MCP Server and AI Tools
Please note that this feature is available in VS Code (and its forks) and JetBrains editors only.
Wallaby’s AI tools and MCP (Model Context Protocol) server integrate with various AI agents, providing real-time runtime context from your codebase and test environment. These tools deliver detailed insights that significantly enhance agent capabilities for analyzing, generating, debugging, and improving code.
Wallaby AI tools and MCP server support Copilot Agent, Cursor, Claude Code, Windsurf, Cline, RooCode, and many other AI agents, enabling them to access Wallaby’s rich runtime insights on demand.
Getting Started
To configure Wallaby MCP server for your AI agent, add the following configuration to your agent’s MCP settings:
{ "mcpServers": { "wallaby": { "command": "npx", "args": [ "-y", "-c", "node ~/.wallaby/mcp" ] } }}Simply use the Wallaby: Open MCP Settings command in your editor to enable Wallaby MCP server. Once enabled, start
Wallaby by running the Wallaby.js: Start command from the command palette and try one of our
example prompts.
How It Works
Without Wallaby, AI agents operate with limited context. They can only access generic CLI output from test runners or basic IDE problem lists and test panels. This surface-level information lacks depth for understanding code behavior, execution paths, and runtime relationships.
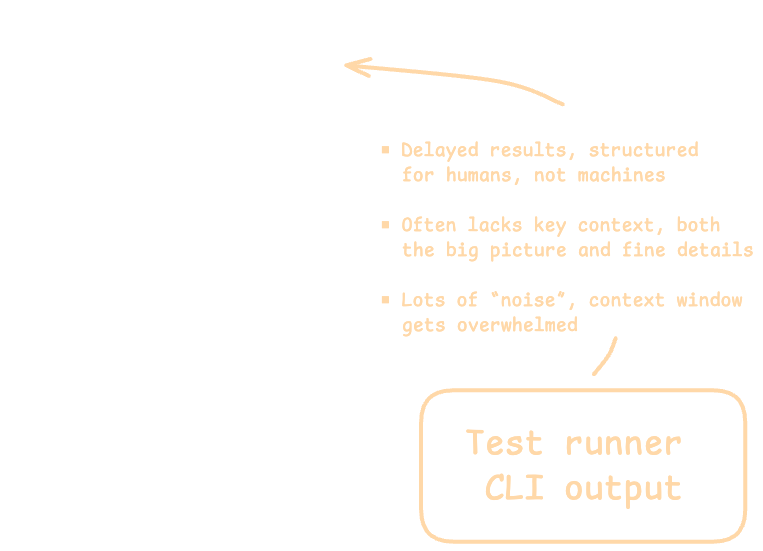
This limitation creates a significant gap in the agent’s ability to debug complex issues, or generate high-quality code/tests that require deeper runtime insights.
With Wallaby’s MCP server and AI tools, agents gain access to a comprehensive, live model of your codebase and test execution environment. This enhanced context includes:
- Real-time runtime values without modifying code
- Complete execution paths for specific tests or entire projects
- Branch-level code coverage analytics
- Detailed code dependency graphs
- Test snapshot management capabilities
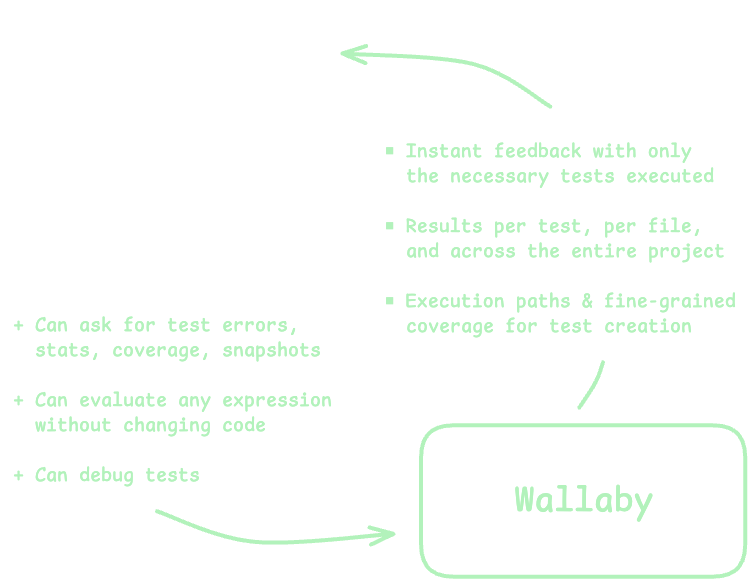
This wealth of contextual information dramatically improves the agent’s ability to analyze, debug, and create code—similar to how a developer with greater insights can solve problems more effectively.
Tools
Wallaby’s MCP server provides AI agents with these powerful tools to access comprehensive runtime context:
Tests
Access test information including status, errors, logs, and code coverage. The agent can retrieve:
- Lists of failing or all tests
- Tests for specific files, lines, or source files
- Detailed test errors and logs
- Aggregated code coverage data
- Global application errors
Example applications:
- Retrieve failing tests to prioritize debugging efforts
- Analyze specific tests to understand execution paths and identify issues
Runtime Values
Access any runtime value in your codebase without modifying code by evaluating any valid code expression such as variables, object states, or function return values.
Values can be requested for all tests or filtered to specific test contexts.
Example applications:
- Debug by examining variable states at specific execution points
- Verify expected behaviors by comparing actual vs. expected values
- Understand data transformations through execution flows
Code Coverage
Access detailed branch-level coverage analytics to:
- Identify execution paths for specific tests
- Map relationships between tests and source code
- Pinpoint uncovered code areas needing additional tests
Example applications:
- Analyze execution paths by examining covered lines for specific tests
- Find tests affected by code changes by identifying which tests cover specific lines
- Determine test dependencies when refactoring or enhancing features
Snapshot Management
Update test snapshots to match recent code changes, ensuring:
- Tests remain current with evolving implementations
- Snapshots accurately reflect expected outputs
Example applications:
- Update snapshots for specific tests after intentional implementation changes
- Batch update snapshots across test files or entire project
Example Use Cases
You can leverage Wallaby’s runtime context to perform a variety of tasks with your AI agent. Here are some example prompts categorized by common use cases:
Fix Failing Tests
Fix all failing tests, check runtime values first to see what is wrongFix test under cursor, check coverage before and after the fixFix tests covering foo.ts or bar function, update snapshots if needed
Create New Tests
Add tests for uncovered lines of the file, verify added test coverage and overall coverage afterFind tests for function under cursor using Wallaby coverage tools, suggest new tests for uncovered lines
Analyze, Plan, and Learn the Codebase
Analyze coverage of test under cursorWhat tests are affected by my current code changes?Debug failing test using runtime valuesList functions of source.ts covered by both "test 1" and "test 2"Identify potential areas for code optimization based on test coverage data
Advanced Workflows
These prompts can be combined to create more comprehensive workflows:
Add this new feature to the project, but add tests first and ensure all tests pass and verify coverage is at least 80% afterwards
SKILL.md
If your AI agent supports custom skills, you can create a Wallaby Testing Skill by adding a SKILL.md file.
---name: wallaby-testingdescription: Check test status and debug failing tests using Wallaby.js real-time test results. Use after making code changes to verify tests pass, when checking if tests are failing, debugging test errors, analyzing assertions, inspecting runtime values, checking coverage, updating snapshots, or when user mentions Wallaby, tests, coverage, or test status.compatibility: Requires Wallaby.js VS Code extension installed and runningmetadata:  author: wallaby.js  version: "1.0"---
# Wallaby Testing Skill
Check test status and debug failing tests using Wallaby.js real-time test execution data.
## When to Use
- **After code changes** - Verify tests pass after modifications- **Checking test status** - See if any tests are failing- **Debugging failures** - Analyze test errors and exceptions- **Inspecting runtime values** - Examine variable states during tests- **Understanding coverage** - See which code paths tests execute- **Updating snapshots** - When snapshot changes are needed- User mentions "tests", "test status", "run tests", or "Wallaby"
## Available Wallaby Tools
Use these tools to gather test information:
| Tool | Purpose ||------|---------|| `wallaby_failingTests` | Get all failing tests with errors and stack traces || `wallaby_failingTestsForFile` | Get failing tests for a specific file || `wallaby_allTests` | Get all tests (useful when there are no failures but you need test IDs) || `wallaby_allTestsForFile` | Get tests covering/executing a specific file || `wallaby_failingTestsForFileAndLine` | Get failing tests covering/executing a specific file and line || `wallaby_allTestsForFileAndLine` | Get tests covering a specific line || `wallaby_runtimeValues` | Inspect variable values at a code location || `wallaby_runtimeValuesByTest` | Get runtime values for a specific test || `wallaby_coveredLinesForFile` | Get coverage data for a file || `wallaby_coveredLinesForTest` | Get lines covered by a specific test || `wallaby_testById` | Get detailed test data by ID || `wallaby_updateTestSnapshots` | Update snapshots for a test || `wallaby_updateFileSnapshots` | Update all snapshots in a file || `wallaby_updateProjectSnapshots` | Update all snapshots in the project |
### What Inputs These Tools Need
- **For file-scoped tools** (like `wallaby_failingTestsForFile`, `wallaby_coveredLinesForFile`): pass the workspace-relative file path.- **For line-scoped tools** (like `wallaby_allTestsForFileAndLine`, `wallaby_runtimeValues`): pass `file`, `line`, and the exact `lineContent` string from the file.- **For test-scoped tools** (like `wallaby_testById`, `wallaby_runtimeValuesByTest`, `wallaby_coveredLinesForTest`): pass `testId` from `wallaby_failingTests` / `wallaby_allTests`.
## Debugging Workflow
### Step 1: Get Failing Tests
Start by retrieving failing test information:- Use `wallaby_failingTests` to see all failures- Review error messages and stack traces- Note the test ID for further inspection
If there are no failing tests but the user is asking about test status or coverage, use `wallaby_allTests` to confirm the current state and to obtain test IDs.
### Step 2: Locate Related Code (Optional)
If the error and stack trace from Step 1 don't provide enough context:- Use `wallaby_coveredLinesForTest` with the test ID- Focus analysis on covered source files- Identify which code paths are executed- Skip this step if the failure cause is already clear
### Step 3: Inspect Runtime Values (Optional)
Examine variable states at failure points or other points of interest:- Use `wallaby_runtimeValues` for specific locations- Use `wallaby_runtimeValuesByTest` for test-specific values- Compare expected vs actual values- Skip this step if the failure cause is already clear
### Step 4: Implement Fix
Based on analysis:- Identify the root cause- Make targeted code changes- Reference runtime values in your explanation
### Step 5: Verify Fix
After changes:- Wallaby re-runs tests automatically- Use `wallaby_testById` to confirm test passes- Check no regressions with `wallaby_failingTests`
### Step 6: Update Snapshots (if needed)
When snapshots need updating:- Use `wallaby_updateTestSnapshots` for specific tests- Use `wallaby_updateFileSnapshots` for all in a file- Use `wallaby_updateProjectSnapshots` only when many snapshots changed- Verify tests pass after updates
## Example: Debugging an Assertion Failure
<example>User: "The calculator test is failing"
1. Call wallaby_failingTests → Get test ID and error   Error shows: "expected 4, got 5" in multiply function2. (Optional) Call wallaby_coveredLinesForTest(testId) → Skip if error is clear3. (Optional) Call wallaby_runtimeValues(file, line, expression) → Skip if cause is obvious4. Analyze: multiply used + instead of *5. Fix: Change + to * in calculator.js6. Call wallaby_failingTests → Confirm no failures remain</example>
## Best Practices
- **Use Wallaby tools first** - They provide real-time data without re-running tests- **Get test IDs early** - Many tools require the test ID from initial queries- **Inspect runtime values** - More reliable than guessing variable states- **Verify after fixes** - Always confirm the test passes before finishing- **Check for regressions** - Ensure fixes don't break other tests
Customizing Agent Behavior
By customizing how your AI agent interacts with Wallaby’s context tools, you can enhance its effectiveness. Please refer to your specific AI agent’s documentation for guidance on customization options.
You can tailor how your AI agent interacts with Wallaby’s context tools by customizing their behavior:
Copilot Instructions
For Github Copilot (with VS Code or VS Code Insiders), we recommend adding the following custom instruction to get the most out of Wallaby’s Copilot integration. This instruction will help Copilot understand to use Wallaby to interact with your codebase and tests before using the terminal or problem panel.
- Open the command palette (Ctrl/Cmd+Shift+P) and run
Chat: Configure Instructions. - Select
Create new instruction file.... - Select where you want to save the instruction file (i.e for your project or globally); we recommend saving it
globally (
User Data Folder). - Name the file when prompted (e.g.
JavaScript/TypeScript Test Operations). - Set the following instruction to the file:
---applyTo: '**'---
# Test Guidelines
## Use Wallaby.js first
- Use Wallaby.js for test results, errors, and debugging- Leverage runtime values and coverage data when debugging tests- Fall back to terminal only if Wallaby isn't available
1. Analyze failing tests with Wallaby and identify the cause of the failure.2. Use Wallaby's covered files to find relevant implementation files or narrow your search.3. Use Wallaby's runtime values tool and coverage tool to support your reasoning.4. Suggest and explain a code fix that will resolve the failure.5. After the fix, use Wallaby's reported test state to confirm that the test now passes.6. If the test still fails, continue iterating with updated Wallaby data until it passes.7. If a snapshot update is needed, use Wallaby's snapshot tools for it.
When responding:- Explain your reasoning step by step.- Use runtime and coverage data directly to justify your conclusions.
Claude Code
To add Wallaby MCP server to Claude Code, run the following command in the terminal:
claude mcp add wallaby -s project -- npx "-y" "-c" "node ~/.wallaby/mcp"If after adding the MCP server as described above you are getting the Connection failed: spawn node error, then it’s
possible that Claude Code MCP client can not resolve your node version. In this case try replacing node with the full
path to node executable in your system, for example:
claude mcp add wallaby -s project -- npx "-y" "-c" "/full/path/to/node ~/.wallaby/mcp"