Code Coverage
When executing your tests and code, Wallaby calculates code coverage to identify which statements of your code have been executed and which statements have not.
Code coverage for your application code is displayed in the left margin of your editor (or through Wallaby’s web-based interface) and is updated in real-time. As soon as you start changing your code, the coverage will be automatically updated.
In addition to in-editor code coverage indicators, summary code-coverage statistics are available the Wallaby Side Panel.
Editor Code Coverage Indicators
Wallaby has five different types of code coverage indicators that are displayed in the left margin of your editor as shown in the screenshot below.
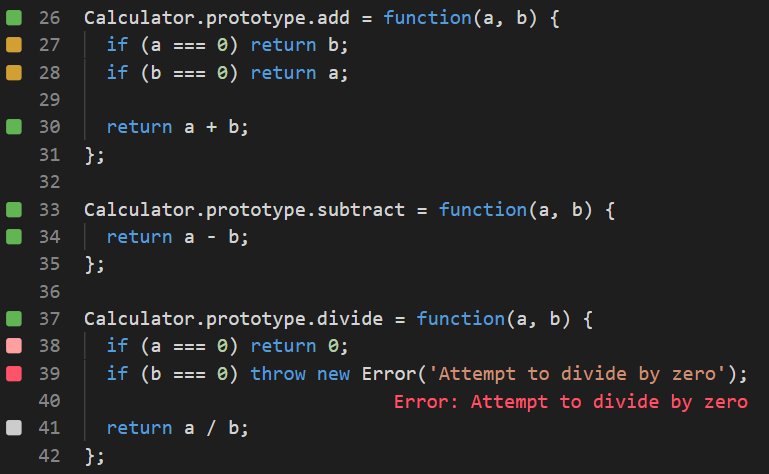
Here is what the coverage indicators mean:
Gray: if you see a gray square next to a line of code, it means that the line of code is not covered by any of your tests.
Yellow: if you see a yellow square next to a line of code, it means that the line of code is only partially covered by your tests.
Green: if you see a green square next to a line of code, it means that the line of code is covered by at least one of your tests.
Pink: if you see a pink square next to a line of code, it means that the line of code is on the execution path of a failing test.
Red: if you see a red square next to a line of code, it means that the line of code is the source of an error or failed expectation, or in the stack of an error.
Uncovered Code Regions
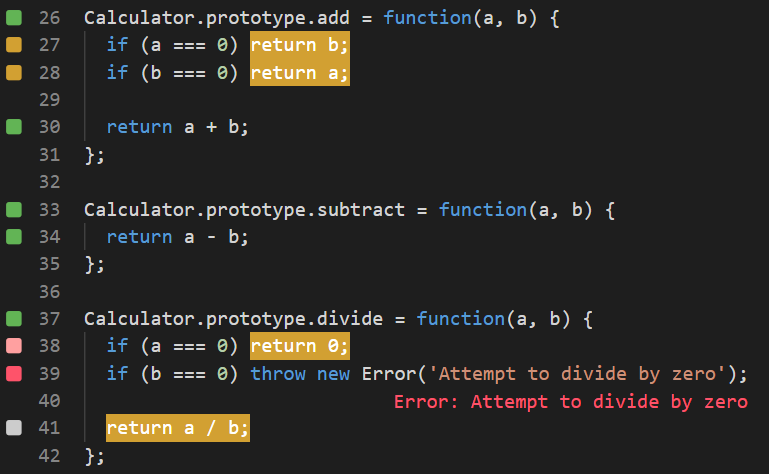
Wallaby’s Toggle Uncovered Code Regions feature allows you to quickly highlight regions of your code that have not
been executed (i.e. for lines with coverage indicators that are Yellow or White). Refer to the relevant tutorial
for your editor to see how to use this command (VS Code,
JetBrains, Visual Studio,
Sublime). This feature is especially useful identifying uncovered code as you
work to improve code coverage.
Tip: use Wallaby App to view your code in read-only mode with uncovered regions always highlighted.
Code Coverage Summary
The Wallaby Side Panel provides a summary of your code coverage statistics. You may click on a filename in the tree view or in the list view to see the uncovered regions of the file. The Coverage tab also includes complexity and change-risk metrics to help identify files where additional tests or simplification may have the most value.
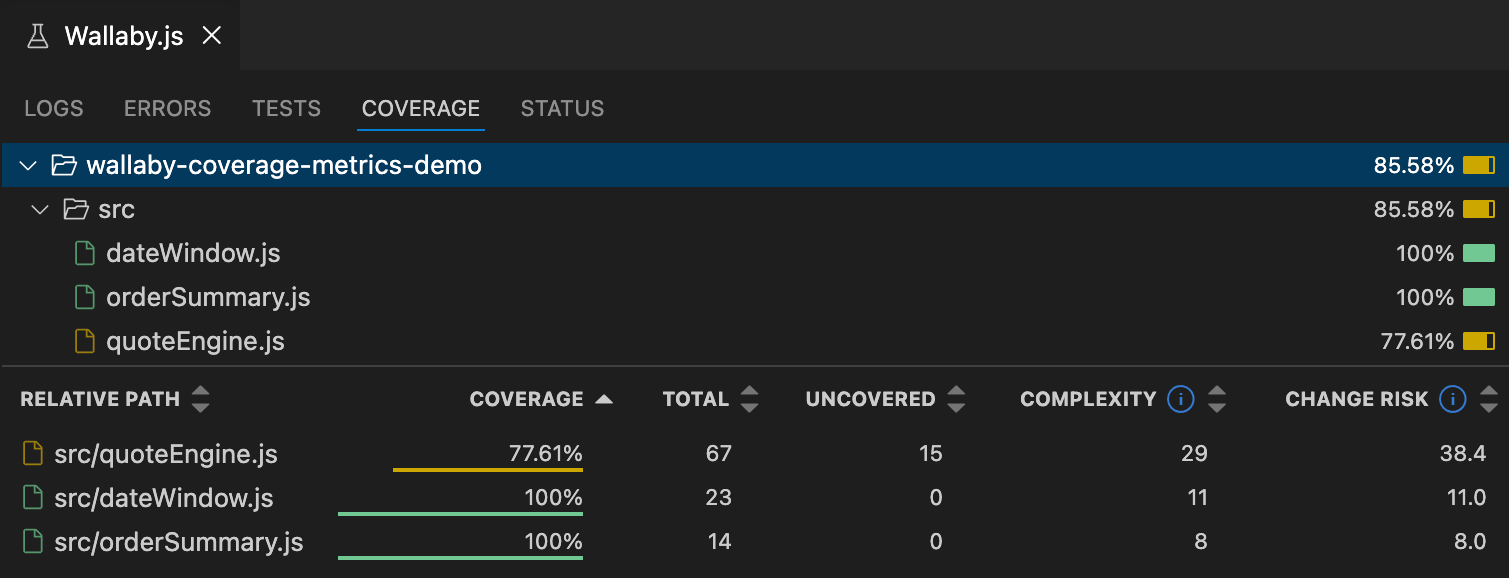
The table includes the following columns:
- Coverage: the percentage of coverable regions executed by Wallaby tests. When a test filter is active, this percentage is scoped to the selected tests.
- Total: the total number of coverable regions Wallaby found in the file.
- Uncovered: the number of regions not covered by any test. When a test filter is active, this still reports completely uncovered regions so the value continues to represent true coverage gaps.
- Complexity: the file’s cyclomatic complexity, calculated as
1 + decision pointsfor each function. Decision points include branches such asifstatements, loops,switchcases, ternaries, and short-circuit logic. - Change Risk: the Change Risk Anti-Pattern score.
The Change Risk score is calculated as:
Change Risk = CC² × (1 - coverage)³ + CCIn the formula, CC is cyclomatic complexity and coverage is Wallaby coverage from 0 to 1.
A higher Change Risk score indicates code that combines higher complexity with lower test coverage. Fully covered files
still show their underlying complexity, because at 100% coverage the score is equal to the file’s cyclomatic
complexity.
Complexity is calculated from the code Wallaby instruments after configured transformations have run. For transformed files such as TypeScript, TSX, Vue, Svelte, Babel output, or framework-generated code, the value should be treated as a practical proxy rather than an exact measure of the original source authored in your editor.
Coverage Settings
It is possible to adjust code coverage calculations and reporting with configuration and code comments. Refer to the configure coverage section of our docs for more information.