Interactive Runtime Value Graphs
The new Interactive Runtime Value Graphs feature lets you visualize runtime data as structured graphs directly in your editor. It’s useful for inspecting deeply nested objects or large data sets that are hard to parse in raw text form. The graph layout adapts well to various data shapes, and you can interactively collapse or expand branches and nodes to focus on the parts that matter. The graph updates automatically as values change, giving you a live view of your log’s state.
How to use
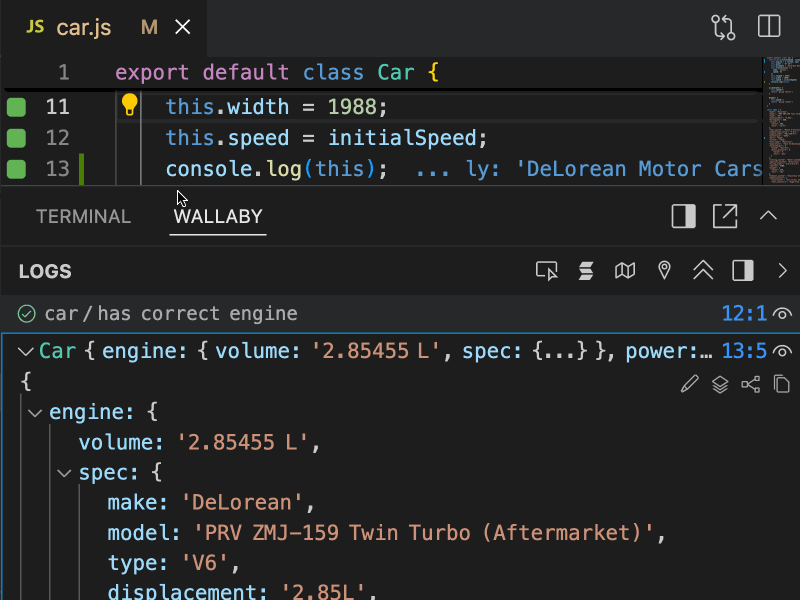
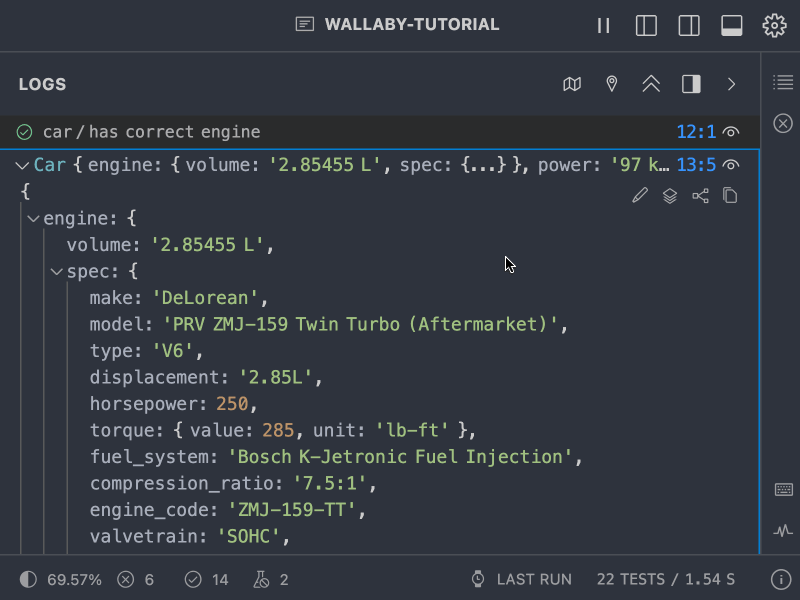
When you run your code, any complex logged runtime value (like an object or array) can be visualized as a graph. You’ll see a small graph icon once you expand the logged value in the Logs list. Click the icon to open the graph view.
Graphs are generated on the fly and reflect the current state of the value. If the value changes, the graph will update automatically.
You can zoom in and out of the graph using the mouse wheel or panel icons. You can also pan the graph by clicking and
dragging the graph area. Holding the Ctrl or Command key while using the mouse wheel will also scroll the graph.
Click the Fit View icon to automatically scale and center the entire graph to fit within the visible area. This is helpful
after a lot of navigation or expansion, so you can quickly reorient yourself and see the overall shape of the data
again.
Nodes and Edges
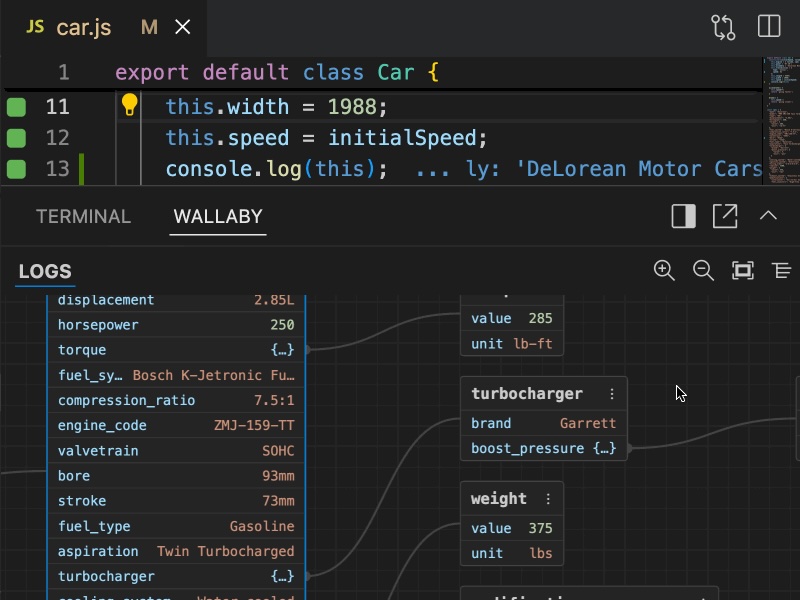
Each node of the displayed graph represents a value — an object or array. Properties of the object or elements of the array are displayed as a list inside the node. The name of the property or index of the array is displayed on the left, and the property value on the right. If the property value is an object or array with some properties, it will be represented as a child node in the graph connected by an edge.
Interactivity
The graph is interactive, allowing you to expand or collapse nodes to explore the structure of the value. You can collapse, expand, or load & expand (in case the property has not been loaded yet) values of properties by clicking on the property value.
Each node has a context menu, available via the vertical ellipses icon in the top right corner of a node. The menu displays the full path to the property node and allows you to copy the property path or the property value to the clipboard.
Supported environments
The feature is available in the following tools:
- Wallaby: VS Code (Cursor, Windsurf, etc.), JetBrains IDEs, all other editors (Zed, NeoVim, etc.) in standalone mode.
- Quokka: VS Code (Cursor, Windsurf, etc.), JetBrains IDEs.
- Console Ninja: support for the feature is coming soon.
Conclusion
This feature is designed to make runtime data easier to understand and interact with, especially when plain text isn’t enough. Whether you’re debugging a complex object or just curious about how your data is structured, Interactive Runtime Value Graphs give you a new way to explore your code in action.
Tweet us at @wallabyjs or drop a line at hello@wallabyjs.com.
Thanks for reading, enjoy visualizing your data! 🚀