Wallaby.js runs your JavaScript tests immediately as you type and displays execution results in your code editor. Wallaby also provides beautiful test and code coverage reports updated in realtime.
In this tutorial we’re going to share how to configure Wallaby.js using the Vue.js CLI. We’ve structured this tutorial so you can follow along. If you don’t want to follow along then you may skip ahead and find the end result in this github repo.
Select your editor
The content of this page is adjusted based on your editor of choice. Please select your editor by clicking on your editor’s logo below before proceeding:


Install Dependencies
First, if you haven’t done so already, go ahead and download and install Wallaby.js.
Create a new Vue.js Application
Now that we’re ready to start, open your terminal and change directory to where we will create our new Vue.js application. Run the following command:
npx @vue/cli create wallaby-vuejs-app --defaultAdd Unit Tests to your project
At this point, your project doesn’t have any unit tests, so we’ll need to add them. In your terminal, change directory to your wallaby-vuejs-app and run the following command:
npx @vue/cli add @vue/unit-jestUpdate your jest configuration
By default vue does not configure jest to collect coverage for your project. Wallaby uses the jest configuration generated by vue, including
jest coverage settings. Update your jest.config.js to collect coverage for your vue files as shown below:
module.exports = {
  preset: '@vue/cli-plugin-unit-jest',
  collectCoverage: true,                      // Add this line
  collectCoverageFrom: ['src/**/*.{js,vue}'], // Add this line
};
Start Wallaby.js
To start Wallaby in VS Code you may run Select Configuration command and then select Automatic Configuration <project directory> option once. After that you may keep using Wallaby Start command as usual and it will start Wallaby with automatic configuration.
To start Wallaby in Sublime Text you may use the Select for Wallaby.js Automatic Configuration context menu item for your project folder in the project’s file tree. After that you may keep using Wallaby Start command as usual and it will start Wallaby with automatic configuration.
To start Wallaby in Visual Studio, you may use the Start Wallaby.js (Automatic Configuration) context menu item for your project folder in the Solution Explorer. After the first start,
the selected project will be remembered for your solution and Wallaby can be started with Tools->Start Wallaby.js (Alt-W, 1).
To start Wallaby in JetBrains IDEs, you may edit (or create a new) wallaby.js Run Configuration by selecting Edit configurations from the drop-down menu in the top right-hand corner of the navigation bar, or from the Run menu. In the run configuration editor set Configuration Type filed value to Automatic.
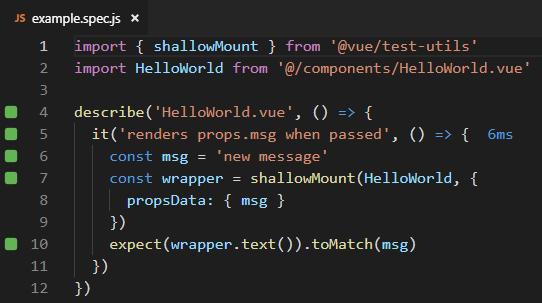
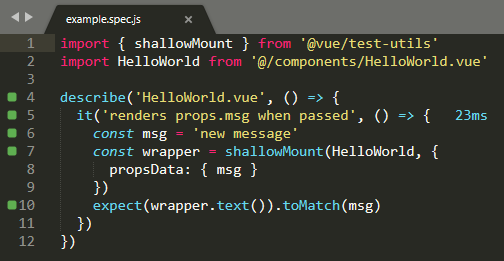
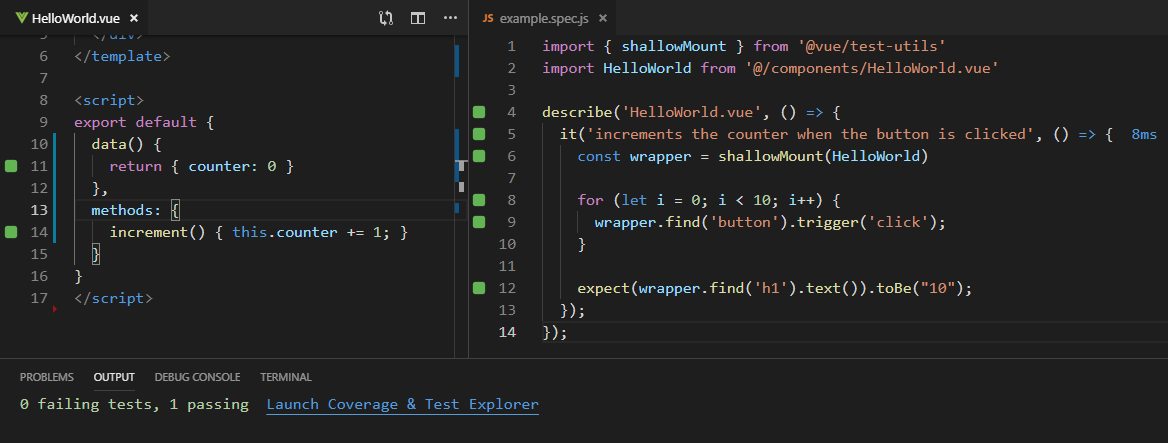
After Wallaby.js has started, navigate to your test file (tests/unit/example.spec.js), you will see coverage indicators in the gutter of your code editor:
- Gray squares mean that the line contains code that was not run by any of your tests.
- Green squares mean that the line contains code that was run by at least one of your tests.
- Yellow squares mean that the line contains code that was only partially covered by your tests.
- Red squares mean that the line is the source of an error, a failed assertion, or is part of a stack trace for an error.
- Pink squares mean that the source line is on the execution path of a failing test.
It should look like this:
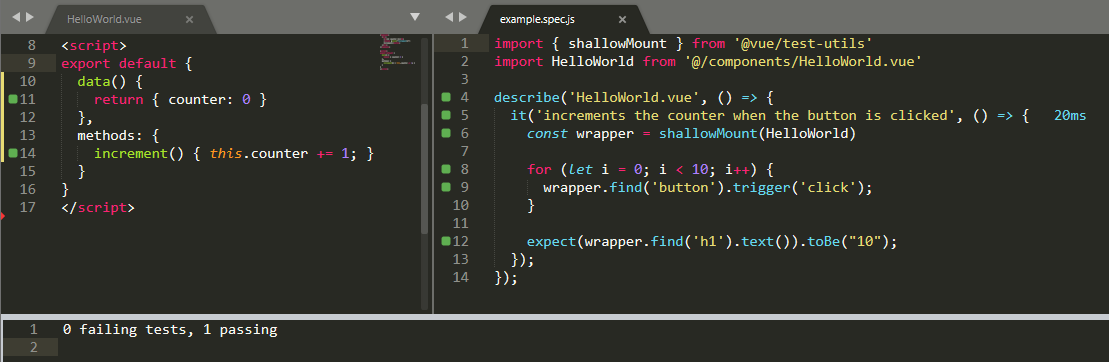
If you open up src/components/HelloWorld.vue, you won’t see any coverage indicators. This is expected because there is currently no code that can execute.
Replace HelloWorld.vue with a simple counter
Let’s replace src/components/HelloWorld.vue to display a counter with an “increment” button:
<template>
  <div>
    <h1>{{ counter }}</h1>
    <button @click='increment()'>Increment</button>
  </div>
</template>

<script>
export default {
  data() {
    return { counter: 0 }
  },
  methods: {
    increment() { this.counter += 1; }
  }
}
</script>
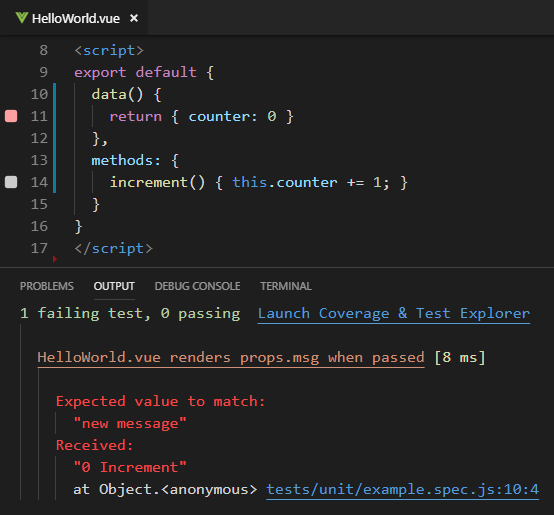
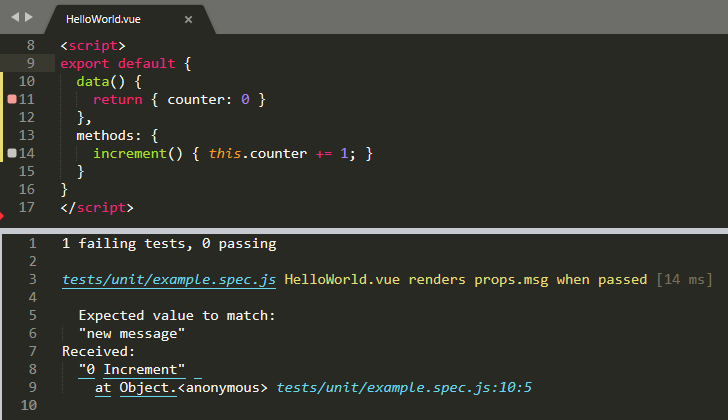
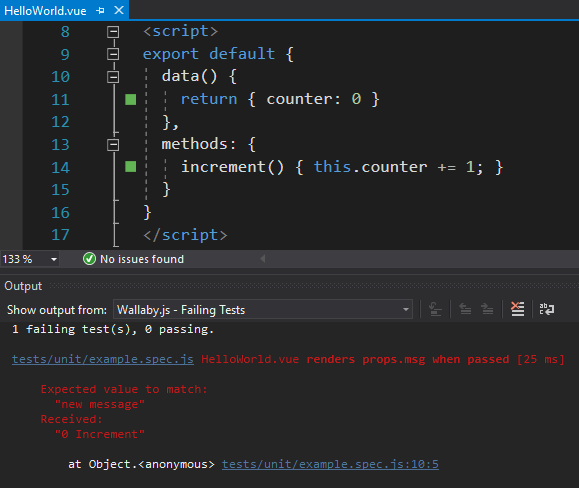
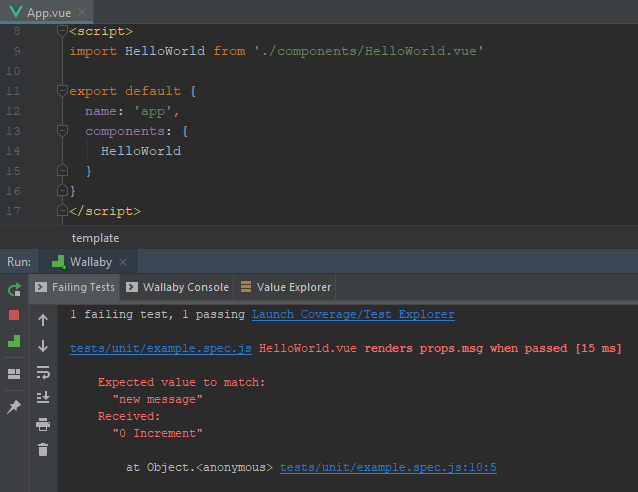
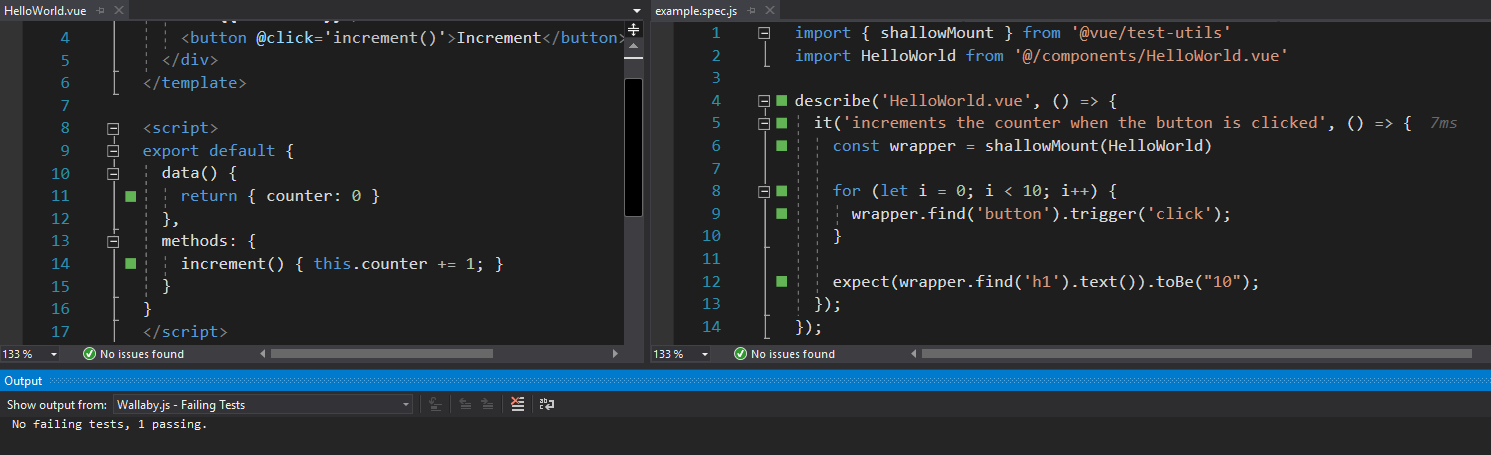
Wallaby.js now shows line markers on HelloWorld.vue with coverage indicators in the gutter showing that tests are broken.
The details of the broken tests are also listed in Wallaby’s test panel.
At this point, you might like to Toggle Wallaby’s Panel by launching the
Command Palette and selecting Wallaby.js: Toggle Tests View.
Fix our test
Now replace example.spec.js with the test below to test the logic for our new counter screen.
import { shallowMount } from '@vue/test-utils'
import HelloWorld from '@/components/HelloWorld.vue'

describe('HelloWorld.vue', () => {
  it('increments the counter when the button is clicked', async () => {
    const wrapper = shallowMount(HelloWorld)

    for (let i = 0; i < 10; i++) {
      await wrapper.find('button').trigger('click');
    }

    expect(await wrapper.find('h1').text()).toBe("10");
  });
});
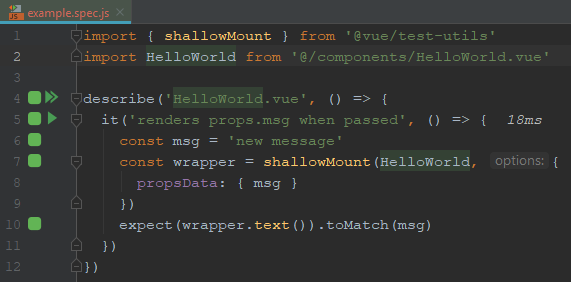
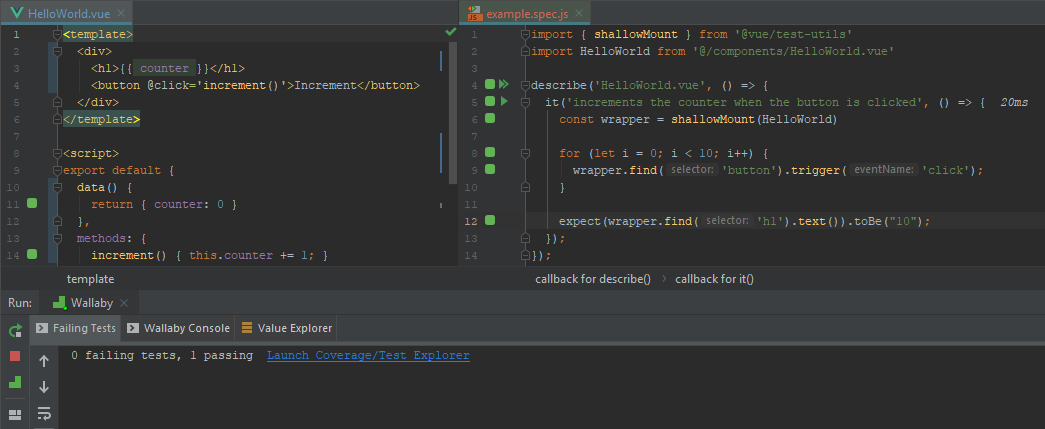
You will see that we now have we now have green coverage markers for our application code and our unit tests. The Wallaby.js test console also now reports that all tests are passing.
Debugging a test
Wallaby’s Time Travel Debugger allows you to move forward and backwards through your code to understand the conditions that led to a specific bug. The Time Travel Debugger accelerates your edit, compile and debug loop by allowing you to jump to a specific line of code, view runtime values, edit-and-continue and step into, over and out of your code.
Wallaby’s Time Travel Debugger allows you to move forward and backwards through your code to understand the conditions that led to a specific bug. The Time Travel Debugger accelerates your edit, compile and debug loop by allowing you to jump to a specific line of code, view runtime values, edit-and-continue and step into, over and out of your code.
Once Wallaby has started, the time-travel debugger is available at any time.
The debugger can be started from any of your project’s tests. Navigate to the line of code where your test
starts and run the command, Wallaby.js: Debug Test (Shift + F5).
In addition to being able to start the debugger on the line of code where your test starts, you may also start the debugger on any line of your code that is executed by your tests. When you start the debugger from a line other than the start of your test, the debugger will start and automatically progress to that line. If you start the debugger from a line of code that is covered by multiple tests, you will be prompted to select which test you want to debug.
Wallaby’s Test Story Viewer provides a unique and highly efficient way of debugging your code and inspecting what code your test is executing in a single logical view. The view is integrated with Wallaby’s Time Travel Debugger and Value Explorer.
Learn More…
We’ve only covered the very basics of configuring and using Wallaby.js but the tool is capable of a whole lot more. Read through our docs to learn more about Wallaby.js features. Some notable features include:
- Wallaby App updates in real-time and provides a strategic level view of coverage and test results.
- Advanced Logging allows you to quickly and easily debug at runtime with keyboard shortcuts, comments, and console log.
- Value Explorer provides the ability to explore runtime values right in your editor.
You may also learn about more Wallaby features in the VS Code tutorialJetBrains IDEs tutorialVisual Studio tutorialSublime Text tutorial.
Vue CLI 4.x - Mocha
The configuration for Vue CLI 4.x projects that use Mocha as their test runner is provided below. Simply copy and paste the configuration into a new wallaby.js configuration
file in your project root directory.
const config = require("@vue/cli-service/webpack.config.js");

const redundantPlugins = {
  ForkTsCheckerWebpackPlugin: true,
  PreloadPlugin: true,
  HtmlWebpackPlugin: true,
  CopyPlugin: true,
  CaseSensitivePathsPlugin: true,
  FriendlyErrorsWebpackPlugin: true,
};

config.plugins = config.plugins.filter(
  (plugin) => !(plugin.constructor && redundantPlugins[plugin.constructor.name])
);

// vue files are split into multiple webpack modules,
// we need to choose and map script webpack resource (i.e. module) to one absolute file path
const mapResourceToPath = (context) => {
  const resource = context.resource;

  if (!resource) return resource;

  if (context.version) {
    // loading phase
    if (resource.endsWith("vue")) {
      return `${resource}?ignore`;
    }

    return resource.indexOf("type=script") > 0
      ? context.resourcePath
      : resource;
  }

  // processing phase
  return resource.indexOf("type=script") > 0 && context.wallaby
    ? resource.substring(0, resource.indexOf("?"))
    : resource.endsWith("vue")
    ? `${resource}?ignore`
    : resource;
};

module.exports = function(wallaby) {
  return {
    files: [{ pattern: "src/**/*.*", load: false }],

    tests: [{ pattern: "tests/**/*.*", load: false }],

    postprocessor: wallaby.postprocessors.webpack(config, {
      setupFiles: [require.resolve("@vue/cli-plugin-unit-mocha/setup")],
      mapResourceToPath: mapResourceToPath,
    }),

    env: {
      kind: "chrome",
    },

    setup: function() {
      // required to trigger test loading
      window.__moduleBundler.loadTests();
    }
  };
};
Vue CLI 3.x - TypeScript and Jest
The configuration for Vue CLI 3.x TypeScript/Jest generated projects is provided below. Simply copy and paste the configuration into a new wallaby.js configuration
file in your project root directory.
module.exports = wallaby => {
  process.env.VUE_CLI_BABEL_TRANSPILE_MODULES = true;

  return {
    files: ['src/**/*', 'jest.config.js', 'package.json', 'tsconfig.json'],

    tests: ['tests/**/*.spec.ts'],

    env: {
      type: 'node'
    },

    preprocessors: {
      '**/*.js?(x)': file => require('@babel/core').transform(
        file.content,
        {sourceMap: true, compact: false, filename: file.path, presets: [require('babel-preset-jest'), require("@babel/preset-env")]})
    },

    setup(wallaby) {
      const jestConfig = require('./package').jest || require('./jest.config');
      jestConfig.transform && delete jestConfig.transform['^.+\\.tsx?$'];
      wallaby.testFramework.configure(jestConfig);
    },

    testFramework: 'jest'
  }
}
Vue CLI 2.x - JavaScript and Jest (Webpack template)
Wallaby expects that your project has the wallaby-vue-compiler dependency that is necessary to run with Vue CLI projects.
yarn add wallaby-vue-compiler -D
   or
npm i wallaby-vue-compiler --save-dev
The configuration for Vue CLI 2.x JavaScript/Jest generated projects is provided below. Simply copy and paste the configuration into a new wallaby.js configuration
file in your project root directory.
module.exports = function (wallaby) {
  return {
    files: ['src/**/*', 'test/unit/*.js', 'package.json'],

    tests: ['test/**/*.spec.js'],

    env: {
      type: 'node'
    },

    compilers: {
      '**/*.js': wallaby.compilers.babel(),
      '**/*.vue': require('wallaby-vue-compiler')(wallaby.compilers.babel({}))
    },

    preprocessors: {
      '**/*.vue': file => require('vue-jest').process(file.content, file.path)
    },

    setup: function (wallaby) {
      const jestConfig = require('./package').jest || require('./test/unit/jest.conf')
      jestConfig.transform = {};
      wallaby.testFramework.configure(jestConfig)
    },

    testFramework: 'jest'
  }
}
Troubleshooting
If you get stuck or something isn’t working for you, you may find a similar solved issue in our github issues repository. If you can’t find a solution, create a new issue.